Monitoring and observability are critical pillars of modern IT infrastructure. As systems grow in complexity, the need for scalable, reliable, and feature-rich monitoring solutions becomes ever more pressing. Prometheus, the de facto standard for monitoring in the cloud-native ecosystem, has served the needs of countless organizations by providing robust, time-series data collection and querying capabilities. However, as organizations scale, so do the demands on their monitoring systems. This is where Grafana Mimir steps in, addressing the limitations of Prometheus and empowering organizations to scale their observability infrastructure effectively.
In this article, we will explore why Grafana Labs developed Mimir, the features it offers, the problems it solves, and how it can be integrated with Prometheus to create a powerful, scalable monitoring solution.
The Rise of Prometheus: Strengths and Limitations
Prometheus, originally developed by SoundCloud in 2012, has become a cornerstone of the cloud-native ecosystem. It excels at collecting and storing time-series data, which can be queried using PromQL, its powerful query language. Prometheus is known for its simplicity, ease of use, and ability to provide real-time monitoring insights. It has been widely adopted due to its native integration with Kubernetes and the vibrant ecosystem of exporters, alerting tools, and dashboards that have grown around it.
Key Strengths of Prometheus:
- Single-Node Architecture: Prometheus is designed as a single-node system, which simplifies its deployment and management.
- Powerful Query Language: PromQL allows users to perform complex queries on time-series data, making it easier to extract meaningful insights.
- Integration with Kubernetes: Prometheus integrates seamlessly with Kubernetes, making it ideal for monitoring containerized applications.
However, while Prometheus is an excellent tool for small to medium-sized environments, its architecture presents challenges as organizations scale. The single-node design, which is one of Prometheus’s strengths, also becomes a limitation in large-scale deployments.
The Challenges of Scaling Prometheus
As monitoring needs grow, organizations often encounter several challenges with Prometheus:
1. Limited Scalability:
- Prometheus operates as a single-node system, which can lead to performance bottlenecks as the volume of data and the number of metrics increase. For large-scale environments, such as those with hundreds or thousands of services, a single Prometheus instance may struggle to keep up with the data ingestion and querying demands.
2. Durability Concerns:
- Prometheus stores data locally on disk, which is sufficient for short-term retention but can be risky in terms of durability. If the node hosting Prometheus fails, the locally stored metrics can be lost unless there is a robust backup strategy in place.
3. Single-Tenancy:
- Prometheus is inherently single-tenant, meaning that different teams or departments within an organization need to deploy and manage separate Prometheus instances. This can lead to operational overhead and complicate efforts to achieve a unified monitoring strategy across the organization.
4. High Availability Challenges:
- While Prometheus can be set up in a high-availability configuration, doing so requires complex setups with redundant instances and careful coordination. Even then, certain scenarios, such as network partitions or region-wide outages, can disrupt monitoring.
Enter Grafana Mimir: Designed for Scale
Recognizing the limitations of Prometheus in large-scale environments, Grafana Labs developed Grafana Mimir—a highly scalable, long-term storage backend for Prometheus metrics. Mimir is not a replacement for Prometheus but rather a complementary system that enhances its capabilities, particularly in terms of scalability, durability, and multi-tenancy.
Why Grafana Created Mimir:
Grafana Labs saw an opportunity to address the growing needs of organizations that rely on Prometheus for monitoring but face challenges as they scale. Mimir was created to offer a solution that:
- Scales Horizontally: Mimir can scale across multiple nodes, handling massive amounts of time-series data without performance degradation.
- Provides Durability: By using cloud-based object storage and replicating data across nodes, Mimir ensures that metrics are durable and protected against data loss.
- Supports Multi-Tenancy: Mimir enables multiple tenants to use the same backend while keeping their data isolated, which is essential for large organizations with diverse monitoring needs.
- Ensures High Availability: Mimir is designed to be resilient to failures, with built-in mechanisms for data replication and recovery.
Key Features of Grafana Mimir
Grafana Mimir introduces several features that address the limitations of Prometheus and makes it an ideal choice for organizations that need to scale their monitoring infrastructure.
1. Horizontal Scalability
One of the most significant advancements Mimir brings is horizontal scalability. Unlike Prometheus, which is confined to a single node, Mimir can scale across multiple nodes in a cluster. This allows organizations to handle a much larger volume of metrics, making it suitable for monitoring extensive infrastructures with numerous services and applications.
- Sharding and Replication: Mimir uses a sharding and replication strategy to distribute data across the cluster. Sharding divides the metrics into smaller chunks that can be processed and stored on different nodes, while replication ensures that each shard is copied to multiple nodes for redundancy. This architecture enables Mimir to scale out as needed, simply by adding more nodes to the cluster.
2. Durable Storage
Mimir solves the durability concerns associated with Prometheus’s local storage. By leveraging cloud-based object storage systems like AWS S3, Google Cloud Storage, or Azure Blob Storage, Mimir ensures that metrics are stored durably and can be recovered in the event of node failures.
- Redundant Storage: Metrics ingested by Mimir are written to both local disk (for fast access) and cloud object storage (for durability). This dual-storage approach means that even if a node fails, the metrics are safe and can be reloaded into the cluster.
3. Multi-Tenancy
Mimir introduces multi-tenancy, a feature that allows multiple tenants to use the same Mimir cluster while keeping their data isolated. This is particularly useful for service providers or large organizations where different teams need their monitoring environments.
- Tenant Isolation: Each tenant in Mimir has its own isolated set of metrics, which are stored and queried independently of other tenants. This ensures that data is secure and that one tenant’s actions do not impact others.
4. High Availability
Mimir is designed with high availability in mind, ensuring that monitoring data remains accessible even in the face of failures. The system’s architecture includes features such as:
- Automatic Failover: If a node in the Mimir cluster fails, the system automatically fails over to another node, ensuring continuous availability of metrics.
- Geo-Redundancy: Mimir can be deployed across multiple regions, with data replicated between them. This protects against region-wide outages and further enhances the availability of monitoring data.
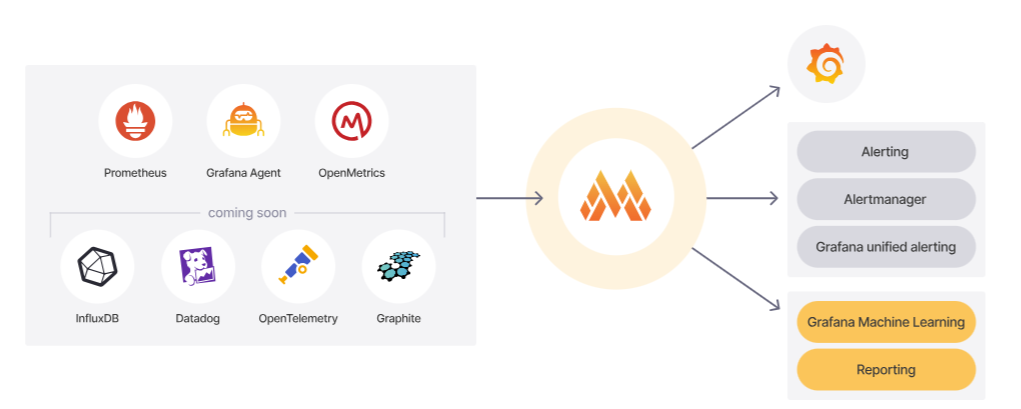
5. Compatibility with Prometheus
One of Mimir’s core strengths is its seamless integration with Prometheus. Organizations that already use Prometheus can adopt Mimir without significant changes to their existing setup. Mimir fully supports Prometheus’s data model, PromQL, and the ecosystem of exporters and alerting tools.
- Drop-in Replacement: Mimir can be used as a drop-in replacement for Prometheus’s long-term storage, allowing organizations to extend the retention period of their metrics without changing their monitoring workflows.
Problems Solved by Grafana Mimir
Grafana Mimir is designed to solve several key problems that organizations face when using Prometheus at scale.
1. Handling Large-Scale Monitoring
As organizations grow, the number of metrics they need to monitor increases exponentially. Prometheus’s single-node architecture can become a bottleneck, leading to performance issues and data loss. Mimir addresses this by distributing the load across multiple nodes, ensuring that the system can handle even the most extensive monitoring environments.
- Example Use Case: A global enterprise with hundreds of microservices running across multiple regions can deploy Mimir to ensure that all metrics are ingested and stored without overloading any single node. This allows the organization to maintain real-time visibility into its entire infrastructure.
2. Ensuring Data Durability and Retention
Prometheus’s local storage is suitable for short-term monitoring, but it lacks durability. In scenarios where long-term retention is required, such as compliance or historical analysis, Prometheus’s native capabilities fall short. Mimir solves this by providing durable, long-term storage using cloud-based object storage.
- Example Use Case: A financial institution that needs to retain monitoring data for several years to comply with regulatory requirements can use Mimir to store metrics durably and retrieve them when needed for audits or analysis.
3. Supporting Multiple Teams with Multi-Tenancy
In large organizations, different teams or departments may have their own monitoring needs. Prometheus’s single-tenancy model requires each team to deploy and manage its instance, which can lead to operational inefficiencies. Mimir’s multi-tenancy allows these teams to share the same backend while keeping their data isolated.
- Example Use Case: A cloud service provider can offer monitoring as a service to its customers, with each customer being a separate tenant in Mimir. This setup allows the provider to manage a single Mimir cluster while giving each customer an isolated monitoring environment.
4. Achieving High Availability in Monitoring
For mission-critical systems, high availability in monitoring is non-negotiable. Prometheus, while reliable, requires complex setups to achieve high availability. Mimir simplifies this by providing built-in high-availability features, such as automatic failover and geo-redundancy.
- Example Use Case: An e-commerce platform that experiences spikes in traffic during sales events can rely on Mimir to ensure that its monitoring data is always available, even if a node or an entire region goes down. This ensures continuous monitoring of application performance, which is crucial for maintaining uptime and customer satisfaction.
Integrating Grafana Mimir with Prometheus: A Practical Approach
Adopting Grafana Mimir doesn’t require organizations to abandon their existing Prometheus setups. Instead, Mimir can be integrated into the existing infrastructure to enhance the capabilities of Prometheus. Here’s how organizations can approach this integration:
1. Setting Up Mimir as a Remote Write Target
- Prometheus supports a feature called Remote Write, which allows metrics to be sent to an external storage system. By configuring Prometheus to use Mimir as a Remote Write target, organizations can continue using Prometheus for real-time monitoring while offloading long-term storage and heavy querying to Mimir.
- This setup allows Prometheus to maintain its role as the primary metric collector while leveraging Mimir for scalability and durability.
2. Configuring Mimir for Querying
- Mimir can also act as a query frontend, meaning that it can handle Prometheus queries (PromQL) directly. This is useful for running large queries that might overwhelm a single Prometheus instance. Organizations can route their queries through Mimir, which will distribute the load across multiple nodes, ensuring fast and reliable query responses.
- By integrating Mimir in this way, organizations can benefit from improved query performance, especially when dealing with long time ranges or large datasets.
3. Seamless Dashboard Integration with Grafana
- Grafana, the visualization layer, can be easily configured to query data from Mimir. Whether organizations are using Grafana dashboards for real-time monitoring or historical analysis, Mimir’s compatibility ensures that the transition is smooth and requires minimal changes.
- This integration enables users to continue using their existing Grafana dashboards while benefiting from the enhanced capabilities that Mimir provides.
Conclusion: Scaling Monitoring for the Future with Grafana Mimir
As organizations continue to grow and their infrastructures become more complex, the need for scalable, durable, and high-performance monitoring solutions becomes paramount. While Prometheus has been a cornerstone of the cloud-native ecosystem, it is not without its limitations—particularly when it comes to scaling, durability, and multi-tenancy.
Grafana Mimir was developed to address these challenges, providing a solution that enhances Prometheus by offering horizontal scalability, durable storage, multi-tenancy, and high availability. By integrating Mimir with Prometheus, organizations can overcome the limitations of single-node monitoring and ensure that their observability infrastructure is ready to meet the demands of large-scale, mission-critical environments.
In a world where uptime, performance, and reliability are more critical than ever, Grafana Mimir offers a way forward, enabling organizations to scale their monitoring solutions effectively and efficiently. Whether you’re managing a small set of services or a global enterprise infrastructure, Mimir provides the tools needed to ensure that you can monitor, analyze, and optimize your systems with confidence.
As the landscape of IT continues to evolve, the ability to scale and adapt your monitoring infrastructure will be key to maintaining competitive advantage. Grafana Mimir is not just a tool for today’s challenges—it’s a solution designed with the future in mind, ensuring that your observability stack can grow with your business.